DIY: Android Malware Analysis - Taking apart OBAD (part 1)
By Zubair Ashraf · Originally published on IBM SecurityIntelligence, 2013 · archived copy, republished here.
If you know the enemy and know yourself, you need not fear the result of a hundred battles. If you know yourself but not the enemy, for every victory gained you will also suffer a defeat. If you know neither the enemy nor yourself, you will succumb in every battle Sun Tzu, The Art of WarI plan on writing regular posts in the DIY series with the goal of not only understanding malware, vulnerabilities and exploits but also to share with our readers some techniques and tools they can use themselves to “know the enemy”. I am also looking forward to hearing about your experiences in analyzing similar threats with similar or more efficient tools & techniques.
Alright, so let’s get right into it, OBAD has been agreed upon to be one of the most sophisticated piece of android malware and you can find various analysis on the web. In this series we will take it apart together and learn about its functionality and various techniques that it uses to gain more power, avoid removal and making analysis harder. In part 1 we will see how to use dynamic code analysis, debugging using jdb, smali (dalvik disassembly source) level debugging, using jdb commands to learn about reflection code being invoked and see through string decryption, using IDA to understand and visualize control and data flow, modifying AOSP code and building a custom system image to bypass anti emulator tricks used by OBAD.
Where to get it from
We will using the sample with md5: e1064bfd836e4c895b569b2de4700284 (VirusTotal analysis) . You can download it from Contagio Mobile
Viewing the contents of the APK files
The apk files can be simply uncompressed just like zip files to obtain their contents, which include the manifest file this is usually in the binary format and can be converted into a readable file by downloading AXMLPrinter2.jar and running
java –jar AXMLPrinter2.jar AndroidManifest.xmlUpon unzipping the apk file you will also get a classes.dex file which is a dex file that contains the application code.
First encounter – let it go wild in a safe environment
To speed things up I would recommend using Mobisec distribution, although it needs a lot of upgrades, but seems to be a good choice to get things started quickly. It comes with a lot of tools pre installed. Once you have it on running on a virtual machine (virtualbox is a pretty neat and robust free virtualization solution). Another advantage of doing this in a virtual machine is that you can take snapshots at desired intervals, revert machine to it during your analysis and try out other routes of analysis.
I have created a short text file showing the steps I took on mobisec VM to upgrade android sdk, download python 2.7 and install drozer – a very powerful framework to test and analyze android apps. You can get it from Upgrading_SDK_in_mobisec_and_installing_drozer
One of the very first things you can do is submit to some of the online analysis services and get an overview of what the sample does (esp. if you are not concerned that this could be a targeted attack and by submitting to online services you may caution the attackers). Here are a few:
- Pretty powerful dynamic analysis tool is the sandbox and analysis technology by JoeSecurity and they offer a free analysis service at APK Analyzer
- A good online tool for static analysis and visuals is Dexter
So you can go ahead and try the OBAD sample with these tools now, or do that later and lets see what we can discover for ourselves.
If you are not already familiar with Android SDK, I would recommend you take some time to review these:
I started with an AVD that comes with the sdk for Android 4.0.3 running api android-15 revision 3 and launched the emulator as:
mobisec@Mobisec:/opt/mobisec/devtools/android-sdk/tools$ emulator-arm -avd Android_4.0.3 -scale 0.75 -debug all -logcat all -no-boot-animOnce the emulator is up you can install the sample as:
mobisec@Mobisec-VM:~$  adb install Malware/OBad/E1064BFD836E4C895B569B2DE4700284.apk
147 KB/s (84306 bytes in 0.558s)
Success
After that if you go and check out the apps installed you do not see any new launcher icon. Let’s take a look at some log entries we can use logcat and see the following relevant messages by running “adb logcat” (for more details you can run it as “adb logcat -d -v long”:
$> adb shell logcat | grep -Ei "E1064B|system.admin"
W/ActivityManager( 80): No content provider found for permission revoke: file:///data/local/tmp/e1064bfd.apk
W/ActivityManager( 80): No content provider found for permission revoke: file:///data/local/tmp/e1064bfd.apk
D/dalvikvm( 753): DexOpt: 'Lcom/android/internal/telephony/IExtendedNetworkService;' has an earlier definition; blocking out
D/dalvikvm( 753): DexOpt: load 77ms, verify+opt 1198ms
D/PackageManager( 80): New package installed in /data/app/com.android.system.admin-1.apk
W/PackageManager( 80): Not granting permission android.permission.MODIFY_PHONE_STATE to package com.android.system.admin (protectionLevel=3 flags=0x8be44)
W/PackageManager( 80): Unknown permission android.permission.ACCESS_BLUETOOTH_SHARE in package com.android.system.admin
I/AppSecurityPermissions( 223): Ignoring unknown permission:android.permission.READ_EXTERNAL_STORAGE
D/PackageManager( 80): generateServicesMap(android.accounts.AccountAuthenticator): 2 services unchanged
D/BackupManagerService( 80): Received broadcast Intent { act=android.intent.action.PACKAGE_ADDED dat=package:com.android.system.admin flg=0x10000010 (has extras) }
How did we know what is the package name that this apk installs? You can figure this out by static analysis tools, or just looking at recent entries from logcat or by looking at the difference in list of packages installed before and after installing the apk under analysis ( “adb shell pm list packages” will come in handy, or the drozer’s app.package.list)
So let us try to get some info about the package we just installed, a lot of information can be extracted by the commands that can be launched via the adb tool in sdk, I also like to use the drozer tool to get info about any package.
Once you are in the drozer console you can try these to get some info about the package as:
mobisec@Mobisec-VM:~$ adb forward tcp:31415 tcp:31415
mobisec@Mobisec-VM:~$ sudo drozer console connect
dz> cd app.package
dz#app.package> run info -a com.android.system.admin
dz#app.package> run attacksurface com.android.system.admin
dz#app.package> run manifest com.android.system.admin
# More interestingly:
dz#app.package> run launchintent com.android.system.admin
tells us that the launcher activity for this package
com.android.system.admin.CCOIoll
# Now if we wanted to manually launch this activity we can do so via:
dz#app.activity> run start --component com.android.system.admin com.android.system.admin.CCOIoll
# if we want to use the sdk tools only we can start this activity as:
mobisec@Mobisec:~$ adb shell am start -a android.intent.category.LAUNCHER -n com.android.system.admin/.CCOIoll
Debugging the application
I will now describe how I went about debugging this application. You can read about the debugging infrastructure and available options here. I used jdb command line debugging and here is how I did my setup. Note, we already have the emulator running and the apk installed. So I started the monitor tool, which has the DDMS tool.
# start the monitor tool
/opt/mobisec/devtools/android-sdk/tools/monitor &    # this has DDMS that can port forward any VM's specific debugging port to the standard port used by jdb which is 8700
In the emulator, go to applications view, click on devtools and then choose “Development Settings”, click on the app name (usually none by default) under “Debug app” and then from the application list scroll down and select com.android.system.admin. Also select “wait for debugger”.
Now you can launch the app using drozer or the sdk tools as
dz#app.activity> run start --component com.android.system.admin com.android.system.admin.CCOIoll
OR
mobisec@Mobisec:~$ adb shell am start -a android.intent.category.LAUNCHER -n com.android.system.admin/.CCOIoll
The application then will wait for a debugger to attach. This will also result in application’s debug port being forwarded to the default port 8700.
I used the command line debugging tool jdb. Note that once a debugger attaches to the app, waitForDebugger method checks to see when the last activity occurred in debugger, and if nothing has happened in a certain time period then it resumes the app so it is important to set any breakpoints etc in .jdbrc file in the home directory that jdb reads upon startup.
jdb can be attached to the application waiting for debugger by:
mobisec@Mobisec:~$ jdb -attach localhost:8700Just before attaching the debugger it will be a good point to create a VM snapshot, so we can return to it when trying different debugging breakpoints during subsequent runs of the app.
I tried debugging this app by setting a breakpoint on onCreate for the launcher activity CCOIoll but it never got hit in the debugger. So I tried the following:
Getting list of all method that the app enters and exits:
This can be done by having the following line in the .jdbrc file in the user’s home directory.
trace go methods
But this did not work, as it caused too much debugger activity and the app was not able to come out of android.os.Debug.waitForDebugger() which depends on the time period elapsed since lastDebuggerActivity() and only exits it it exceeds a set duration. So then I realized let’s try to break on application entry point i.e. for our case I added the following in the .jdbrc file
stop in com.android.system.admin.COcCccl.onCreate
and attached the jdb to the app:
mobisec@Mobisec-VM:~$ jdb -attach localhost:8700
Set uncaught java.lang.Throwable
Initializing jdb ...
Deferring breakpoint com.android.system.admin.COcCccl.onCreate.
> > Set deferred breakpoint com.android.system.admin.COcCccl.onCreate
Breakpoint hit: "thread=<1> main", com.android.system.admin.COcCccl.onCreate(), line=4,327 bci=0
<1> main[1]
When this breakpoint hits then you can run
<1> main[1] trace go methodsThis gives us an idea of what parts of the code were executed, by comparing the entry and exit lists we also see that we enter com.android.system.admin.COcCccl.onCreate() but do not exit it, so somewhere in there we exit the application. We do not see any method entry that shows us that some anti VM checks are happening nor do we see any java methods that cause application shutdown. One of the reason for these is
"exclude" feature in jdb,
running help in jdb and we see
exclude [, ... | "none"]   -- do not report step or method events for specified classes
issuing the exclude command on jdb prompt we see
> > exclude
So we do not see methods being entered / exited from these packages, when we run trace go methods.
Let us then try to explicitly set a breakpoint at java.lang.System.exit, we already have a VM snapshot we can revert to, edit our .jdbrc file (put in “stop in java.lang.System.exit(int)”), run the app again, attach jdb to it and we see:
mobisec@Mobisec-VM:~$ vi ~/.jdbrc;jdb -attach localhost:8700
Set deferred uncaught java.lang.Throwable
*** Reading commands from /home/mobisec/.jdbrc
> > cont
>

[1] java.lang.System.exit (System.java:181), pc = 0
[3] android.app.Instrumentation.callApplicationOnCreate (Instrumentation.java:969), pc = 0
[5] android.app.ActivityThread.access$1300 (ActivityThread.java:123), pc = 0
[7] android.os.Handler.dispatchMessage (Handler.java:99), pc = 20
[9] android.app.ActivityThread.main (ActivityThread.java:4,424), pc = 34
[11] java.lang.reflect.Method.invoke (Method.java:511), pc = 17
[13] com.android.internal.os.ZygoteInit.main (ZygoteInit.java:551), pc = 66
<1> main[1]
So it is now time to dive into source code.
Source code for the Android application and smali code debugging
Remember earlier we talked about getting a dex file from the apk file. Android code is typically written in Java, the Java class files are then converted into .dex (i.e. Dalvik Executable) file which run on the Dalvik virtual machine that is used in Android.
What can you do with these .dex files?
I like the following options (and there may be others):
- IDA pro is able to disassemble .dex files, and show you graphs and provide other analysis capabilities of IDA
- Use dex2jar to get a java jar file from .dex file and then use a java decompiler to get java source files (such as jd-gui)
- Use the commercial Android decompiler to get Java source from the apk
- You can also work directly with dalvik assembly code using smali which provides an assembler/disassembler for the dex format, sometimes it is valuable to look directly at smali code to avoid any decompilation error from Java decompilers which can be caused due to malware using tricks to cause the Java decompiler to fail or give misleading output.
- apktool is a very powerful tool to reverse engineer android apps, modify dalvik code, repackage into apk, source code level debugging of smali code etc
Debugging at smali source level
apktool version 2 has pretty nice support for smali debugging, at the time of writing this entry, version 2 was not released but can be built from source
Once you have built version 2 of the apktool, you can do the following:
#decompile the apk with -d (debugging)
c:\downloads\apktool_2\Apktool\brut.apktool\apktool-cli\build\libs>java -jar apktool-cli-2.0.0-Beta5.jar d -d -o decompiled_with_apktool_2_with_debug d:\OBad\E1064BFD836E4C895B569B2DE4700284.apk
This will give you (among other things) java source files with smali code, e.g.
you will find COcCccl.java in decompiled_with_apktool_2_with_debug\smali\com\android\system\admin
and if you look at the code for onCreate you would see it as:
a=0;// # virtual methods
a=0;// .locals 10
a=0;// invoke-super {p0}, Landroid/app/Application;->onCreate()V
a=0;// invoke-direct {p0}, Lcom/android/system/admin/COcCccl;->oIOccOcl()Z
a=0;// move-result v0
a=0;// #v0=(Boolean);
a=0;//
a=0;//
a=0;// invoke-static {v0}, Ljava/lang/System;->exit(I)V
We will talk about how this will be useful for debugging in a short while, let’s look at how you can repackage this into an apk file. If you like you can modify the smali code before repackaging.
Repackaging into an apk
Prior to repackaging delete the MANIFEST folder that contains signatures and certs – so that you can freshly sign it.
Note, since OBAD uses a non compliant android manifest file, to confuse tools, you will have to first fix it
To be sure your manifest file is valid you can use the aapt tool (you will find it under platform tools in your android sdk installation:
aapt p --debug-mode -M d:\OBad\E1064BFD836E4C895B569B2DE4700284.apk\decompiled_with_apktool_2_with_debug\AndroidManifest.xmlTo resolve errors you can refer to specs here, once you have edited the xml file so that no more errors are reported you can proceed to repackage as:
D:\apktool_2\Apktool\brut.apktool\apktool-cli\build\libs>java -jar apktool-cli-2.0.0-Beta5.jar b -d -o E1064BFD836E4C895B569B2DE4700284_rebuilt_with_apktool_2_with_debug.apk d:\OBad\decompiled_with_apktool_2_with_debug
# signing your apk - you can read the details here (below is what I did)
# creating keystore

D:\>"c:\Program Files\Java\jdk1.7.0_07\bin\jarsigner.exe" -keystore d:\downloads\MYKEYSTORE.keystore -storepass  -keypass  -digestalg SHA1 -sigalg MD5withRSA -verbose -certs E1064BFD836E4C895B569B2DE4700284_rebuilt_apktool_2_dbg.apk myXFKey
#zipalign - for optimization

D:\>"c:\Program Files\Java\jdk1.7.0_07\bin\jarsigner.exe" -verify -verbose -certs E1064BFD836E4C895B569B2DE4700284_rebuilt_apktool_2_dbg_aligned.apk
Now that we have the recompiled/repackaged apk, lets install it, and get ready to attach jdb to it as described above. Again taking a VM snapshot just before attaching jdb would be helpful. We add the statement “stop in java.lang.System.exit(int)” in .jdbrc file and now that we have access to smali code in jdb we also tell jdb about it by using
use /home/mobisec/Malware/OBAD/decompiled_with_apktool_2_with_debug/smali/
We can now use those as regualar files for setting breakpoints at specific line numbers in java files and examine smali variables as java variables
mobisec@Mobisec-VM:~$ jdb -attach localhost:8700
Set deferred uncaught java.lang.Throwable
*** Reading commands from /home/mobisec/.jdbrc
> > > cont
>

[1] java.lang.System.exit (System.java:181), pc = 0
[3] android.app.Instrumentation.callApplicationOnCreate (Instrumentation.java:969), pc = 0
[5] android.app.ActivityThread.access$1300 (ActivityThread.java:123), pc = 0
[7] android.os.Handler.dispatchMessage (Handler.java:99), pc = 20
[9] android.app.ActivityThread.main (ActivityThread.java:4,424), pc = 34
[11] java.lang.reflect.Method.invoke (Method.java:511), pc = 17
[13] com.android.internal.os.ZygoteInit.main (ZygoteInit.java:551), pc = 66
<1> main[1]
# change frames, list source code, and examine variables
<1> main[1] up
5,754 a=0;//
5,756 a=0;//
5,758 => a=0;// invoke-static {v0}, Ljava/lang/System;->exit(I)V
5,760 a=0;// :cond_4
5,762 a=0;// sget-object v0, Lcom/android/system/admin/COcCccl;->oCIlCll:Landroid/content/Context;
<1> main[2] locals
Local variables:
v8 = instance of android.os.PowerManager(id=830019453032)
v2 = instance of byte[3] (id=830019585672)
v5 = -12
v1 = "sdk"
Now we can look at the contents of the file smali/com/android/system/admin/COcCccl.java that was generated by apktool, and we see:
We can pull up this code in IDA as well and have a better view of control and data flow. This can be done by unzipping the newly packaged apk file that we created with apktool and opening the classes.dex file in IDA Pro. When I did that I encountered the following error:
bad dex version (0×30 33 36 00)
The developers are aware of this and this may been fixed now, but if you get this error you can fix this by fixing the version in dex file. You can open the dex file in any hex editor and change the hex value at offset 6 from 0×36 to 0×35, save the modified classes.dex file and open it in IDA. (0×30 is ASCII code for ’0′, 0×33 for ’3′ and 0×36 for ’6′)
Note the bytecode index /pc value and the line number that we see in stack trace from jdb is not the same as hex addresses / or even relative distance from start of method in the IDA view, as IDA view disassembles dex byte. Nevertheless, we can find the code area we are looking for in a method and analyse in IDA, so for our exit call at hand we see:
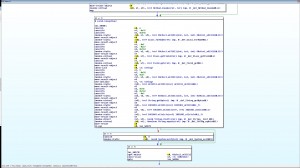
IDA showing code logic to exit
Looking at this we see that we exit if the string comparison results in true, we do not take the branch in if-eqz, and so we call System.exit()
invoke-virtual {v0, v1},
Also we can see that v1 = “sdk” from the output of the “locals” command in jdb and IDA graph shows us that v0 comes from use of string decryption and reflection:
CODE:0004A4C8 invoke-static {v0, v1, v2},
CODE:0004A4D0 invoke-static {v0},
CODE:0004A4D8 const/16 v1, -0xE
CODE:0004A4E0 const/16 v3, 0x163
CODE:0004A4EA move-result-object v1
CODE:0004A4F2 move-result-object v0
CODE:0004A4F6 invoke-virtual {v0, v1},
This seems like some anti VM/emulator check, and what I did next was get information about all reflection related calls to get an idea of what the malware is doing, and then also annotated what each call was returning so that all this information would be handy for further analysis.
This is the .jdbrc I used for gathering reflection related information: (Note for a different sample, you can also grep the smali code for reflection related calls and set your breakpoints accordingly)
.jdbrc:
monitor print this
monitor where
monitor cont
stop in java.lang.Class.getDeclaredField(java.lang.String)
stop in java.lang.Class.getField(java.lang.String)
stop in java.lang.Runtime.exec(java.lang.String)
stop in java.lang.Runtime.exec(java.lang.String[],java.lang.String[])
stop in java.lang.Runtime.exec(java.lang.String,java.lang.String[],java.io.File)
stop in java.lang.System.exit(int)
I use the suspend, cont, resume commands to just cause additional delay so that all the output gets printed properly and not interleaved, note the use of breakpoints on exec, this can show you if the app invoked external processes, and can be interesting, if you try it out you will see that OBAD does invoke an external program and uses the result to check something, I will let you discover it.
You can use this .jdbrc, run jdb and redirect output to a file for later analysis. We learnt that the interesting reflection call was just java.lang.Class.getField and this is what we found out for the names of Classes and fields for which getField is invoked.
# fields accessed
<1> main[1] this = "class android.app.ActivityManager$RunningAppProcessInfo"
<1> main[1] this = "class android.app.ActivityManager$RunningAppProcessInfo"
<1> main[1] this = "class android.os.Build$VERSION"
this = "class android.os.Build"
<1> main[1] this = "class android.os.Build"
<1> main[1] this = "class android.os.Build"
<1> main[1] this = "class android.os.Build"
<1> main[1] this = "class android.os.Build"
<1> main[1] this = "class android.os.Build"
<1> main[1] this = "class android.os.Build"
<1> main[1] this = "class android.os.Build"
<1> main[1] this = "class android.os.Build"
<1> main[1] this = "class android.os.Build"
<1> main[1] this = "class android.provider.Settings$Secure"
this = "class android.content.pm.PackageInfo"
<1> main[1] this = "class android.content.pm.ApplicationInfo"

D:\>grep -E "name| \[1\]| \[2]" OBAD_Reflection_Related_Code_Entries_Params_ST.txt
<1> main[1]
[2] com.android.system.admin.COcCccl.oIOccOcl (COcCccl.java:3,776)
<1> main[1]
[2] com.android.system.admin.COcCccl.onCreate (COcCccl.java:4,965)
<1> main[1]
[2] com.android.system.admin.COcCccl.cIoCcIo (COcCccl.java:2,023)
[1] java.lang.Class.getField (Class.java:782)
name = "DEVICE"
[2] com.android.system.admin.COcCccl.cIoCcIo (COcCccl.java:2,117)
[1] java.lang.Class.getField (Class.java:782)
name = "ID"
[2] com.android.system.admin.COcCccl.cIoCcIo (COcCccl.java:2,213)
[1] java.lang.Class.getField (Class.java:782)
name = "PRODUCT"
[2] com.android.system.admin.COcCccl.cIoCcIo (COcCccl.java:2,307)
[1] java.lang.Class.getField (Class.java:782)
name = "TYPE"
[2] com.android.system.admin.COcCccl.cIoCcIo (COcCccl.java:2,401)
[1] java.lang.Class.getField (Class.java:782)
name = "ANDROID_ID"
[1] java.lang.Class.getField (Class.java:782)
name = "applicationInfo"
[1] java.lang.Class.getField (Class.java:782)
name = "flags"
[1] java.lang.Class.getField (Class.java:782)
name = "MODEL"
[2] com.android.system.admin.COcCccl.onCreate (COcCccl.java:5,683)
Note, this shows us info about what was called and from where, but not the return values, so that can be obtained by setting breakpoints just after the call returns and dumping locals etc. Anyways for our exit situation we see that line COcCccl.java:5,683 calls getField to get android.os.Build.MODEL which results in “sdk” for the emulator image and therefore we exit.
Fooling the anti Emulator check
There are various strings and settings that can tell about the system, os, hardware etc, most of these can be seen by running getprop on shell, such as “adb shell getprop”. For reference you can view results of running getprop for a few configurations by looking at the linked files.
- From a real galaxy nexus device: getprop.galaxy.nexus
- An android sdk emulator running system image for api 18 revision 2: getprop_Android_sdk_18_rev_2
- An android sdk emulator running system image build from Android Open Source Project code for 4.3 getprop_AOSP_4.3_modified_src
Now to bypass the anti VM tricks used by malware there are various different techniques:
A. modify the smali code so that the check is ignored as suggested in this InsomniHack 2012 presentation by @cryptaxB. Use of ldpreloadhook as outline in Adventures in Anti-Emulator part of the BlachHat presentation DexEducation-PracticingSafeDex by @timstrazzC. Modify AOSP code as needed, compile, and use the generated system image to be run in the emulator that comes with android sdk. (this is what I would like to talk about below)
Modifying, compiling and using the compiled system image with the emulator
Instructions to download and build AOSP can be found here.
Class android.os.build fields such as model are populated within android/os/Build.java, so I fetched AOSP code for branch 4.3_r3 and made the following changes:
zashraf@ubuntu-10-x64:~/Android/src_4.3_r3$ diff ./frameworks/base/core/java/android/os/Build.java.modified ./frameworks/base/core/java/android/os/Build.java.orig
< import android.util.Log;
< public static String getString(String property) {
< Log.i("XF_IBM", "getString called for "+ property +" returning :" + p );
< {
< Log.i("XF_IBM", " Hooking return of SDK");
< if (!property.equals("ro.product.name") && !p.equals("sdk"))
< p = "yakju";
< }
---
> return SystemProperties.get(property, UNKNOWN);
I selected the target “aosp_arm-eng”, compiled and obtained a fresh system.img file in out/target/product/generic/, this is what I will use with the emulator and install OBAD on it.
Creating a new AVD for emulator to run the custom built system.img
- Create copies of android-18 in system-images and platforms sub directories under your sdk root direcotry. (I named the copies android-18_customized)
- Copy over the newly build system.img under the system-images folder (for my mobisec default config it was /opt/mobisec/devtools/android-sdk/system-images/android-18_customized/armeabi-v7)
* Making the following edits:
diff -r android-18/source.properties android-18_customized/source.properties
< Platform.Version=4.3
> Platform.Version=4.3_Custom
< AndroidVersion.ApiLevel=18
> AndroidVersion.ApiLevel=18_custom
and in system-images:
8c8
---
14c14
---- Create avd – by running and selecting the newly created api-18_customized target for your new virtual device configuration.
android avd
I named my device Nexus_4_on_4.3_api_18_custom. Now everything should be taken care of, but for some reason, either it is the smartness of the SDK, or I missed something, so make sure things are as they should be – edit the avd config file and have the system.img pointing to your custom system image
For me the config files was /home/mobisec/.android/avd/Nexus_4_on_4.3_api_18_custom.avd/config.ini
After this if you run
android list target
you should see
Name: Android 4.3_Custom
API level: 18
You can launch the emulator as:
emulator-arm -avd Nexus_4_on_4.3_abi_18 -scale 0.75 -debug all -logcat all -no-boot-animIf you hit a breakpoint in jdb and try this you would see the modified java code doing its trick:
<1> main[1] print android.os.Build.MODELNote, as we have just modified java code, the values returned by getprop command are not changed.
If you then install OBAD on this new AVD, and then manually start the launcher activity you would see the following screen to get Device Admin access. Why do you need to start the launcher activity manually, and why does it not request the device admin permission upon install, is something for next blog entry, or perhaps I will let you figure it out.
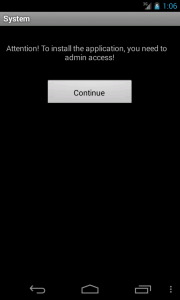
Asking for Device Admin permission
BTW we did not need to modify the AOSP code to work with OBAD, as you can see from the getprop output for AOSP, the value returned for build.model is not “sdk” by default, but nevertheless now you know how you can customize the android java library code.
Well that’s it for today, I hope you enjoyed and benefited from the post and I look forward to your feedback.
Did you try these tools and techniques? Have you find something to be more efficient and powerful for your taste? Go ahead leave me a comment below and let me know your thoughts!